Find the losses.
Compare volumes between stages and identify differences to guide adjustments on the line.
 Let's talk
Intelligence for the poultry industry
We turn images from the processing line into data to improve productivity, address losses and manage quality.
Explore the technology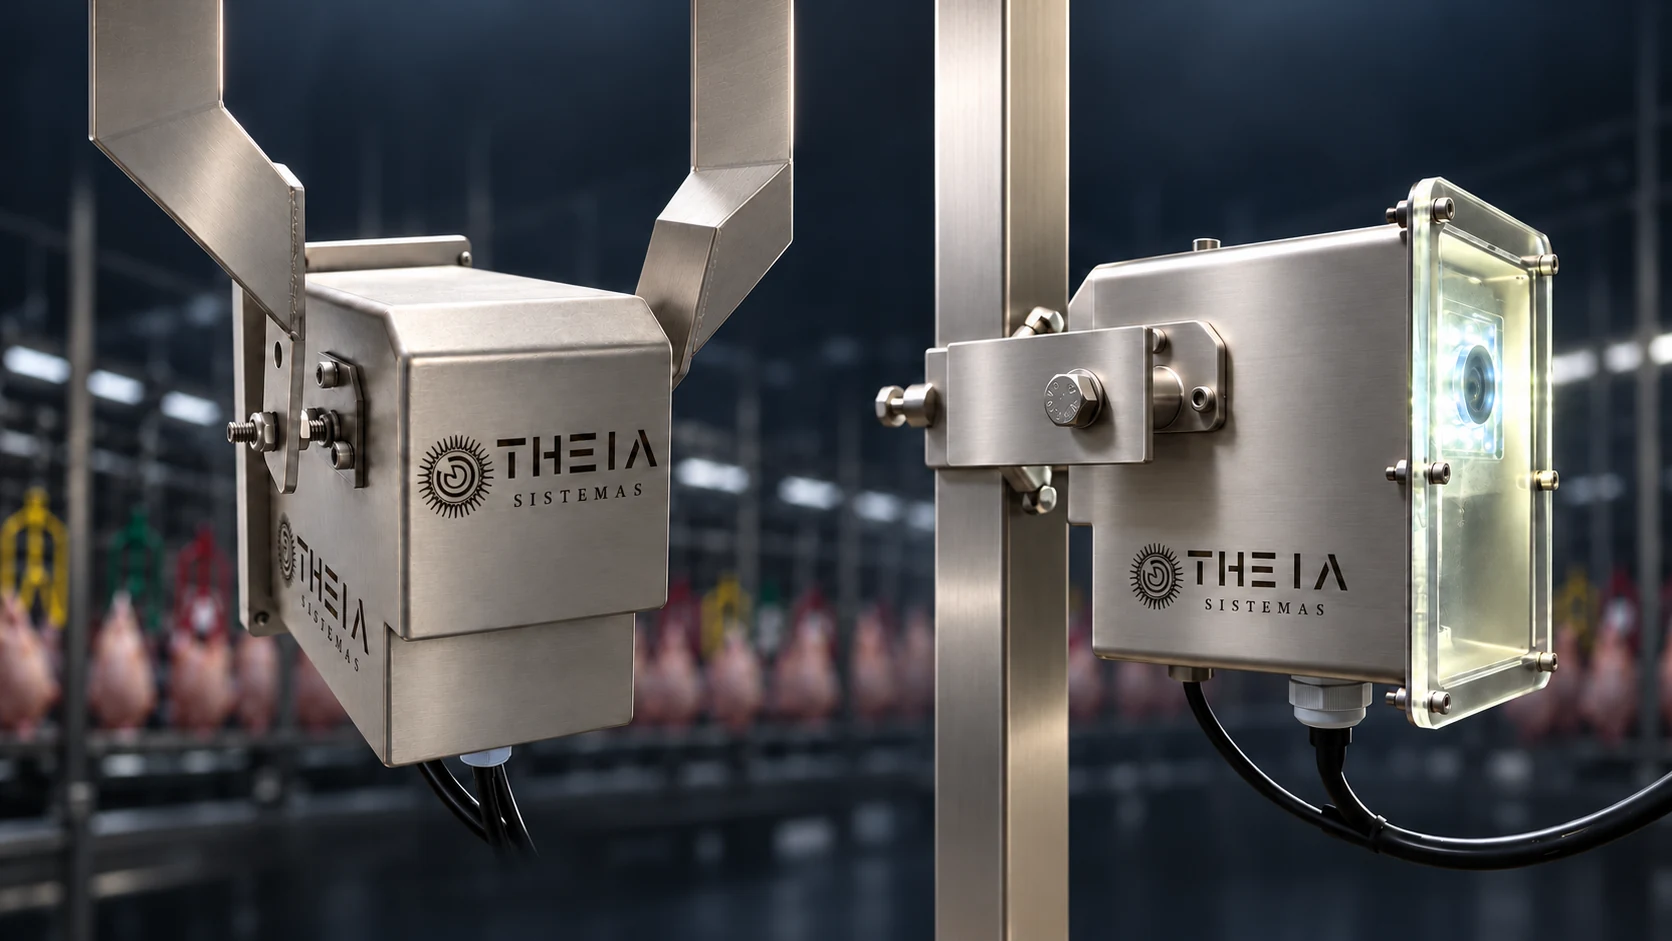
Production. Quality. In real time.
Keep exploringFrom line to decision
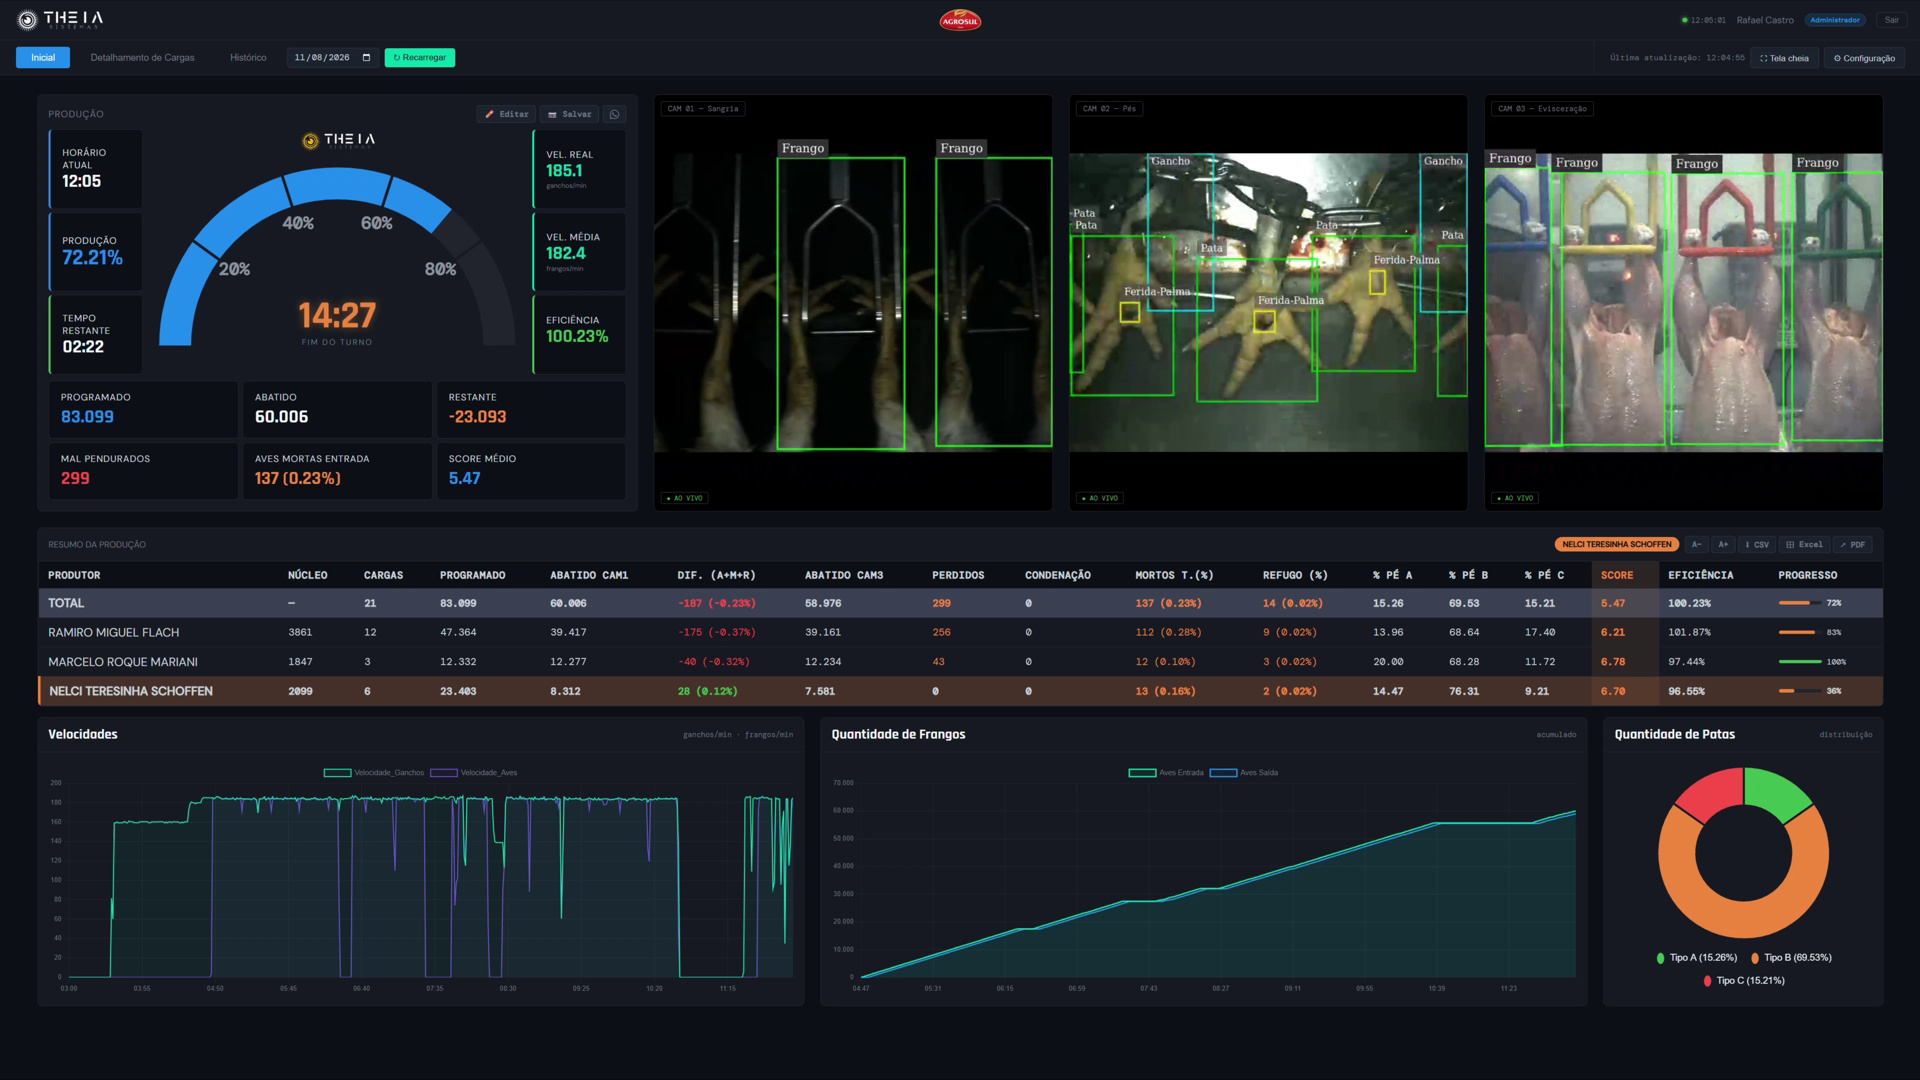
See the process clearly. Understand where losses occur, how production is progressing and what each load's quality reveals.
Compare volumes between stages and identify differences to guide adjustments on the line.
Use production flow and estimated completion time to plan the shift.
Compare loads and contract growers to prioritize quality improvements.
Computer vision
C1 · Line entry
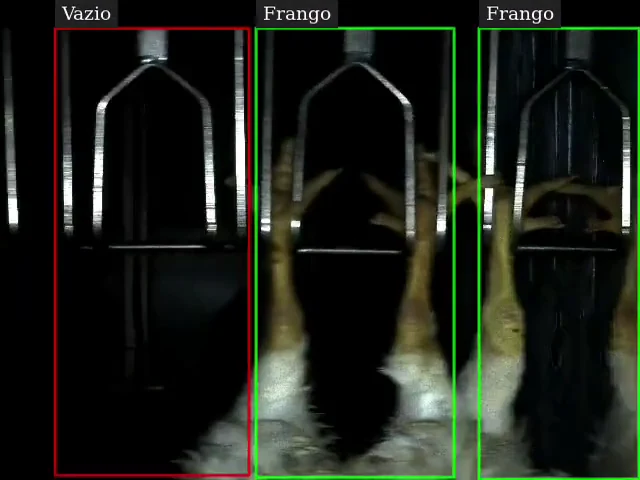
Counting in the bleeding area establishes the baseline volume entering the process.
C2 · Feet inspection
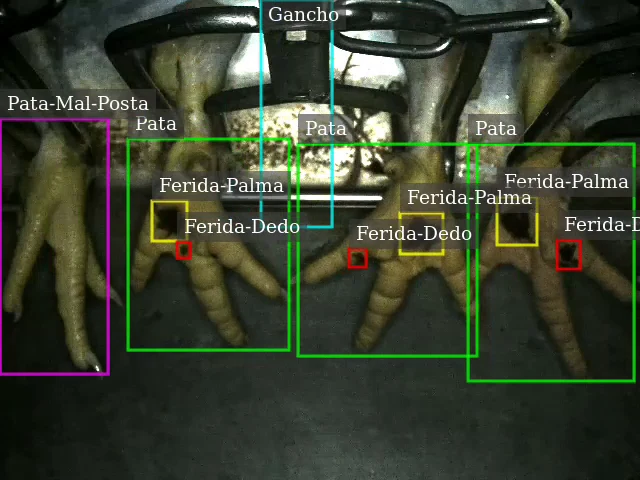
Count feet, identify losses from feet falling off shackles and monitor quality.
Grading criteria tailored to your operation.
C3 · Carcass breast
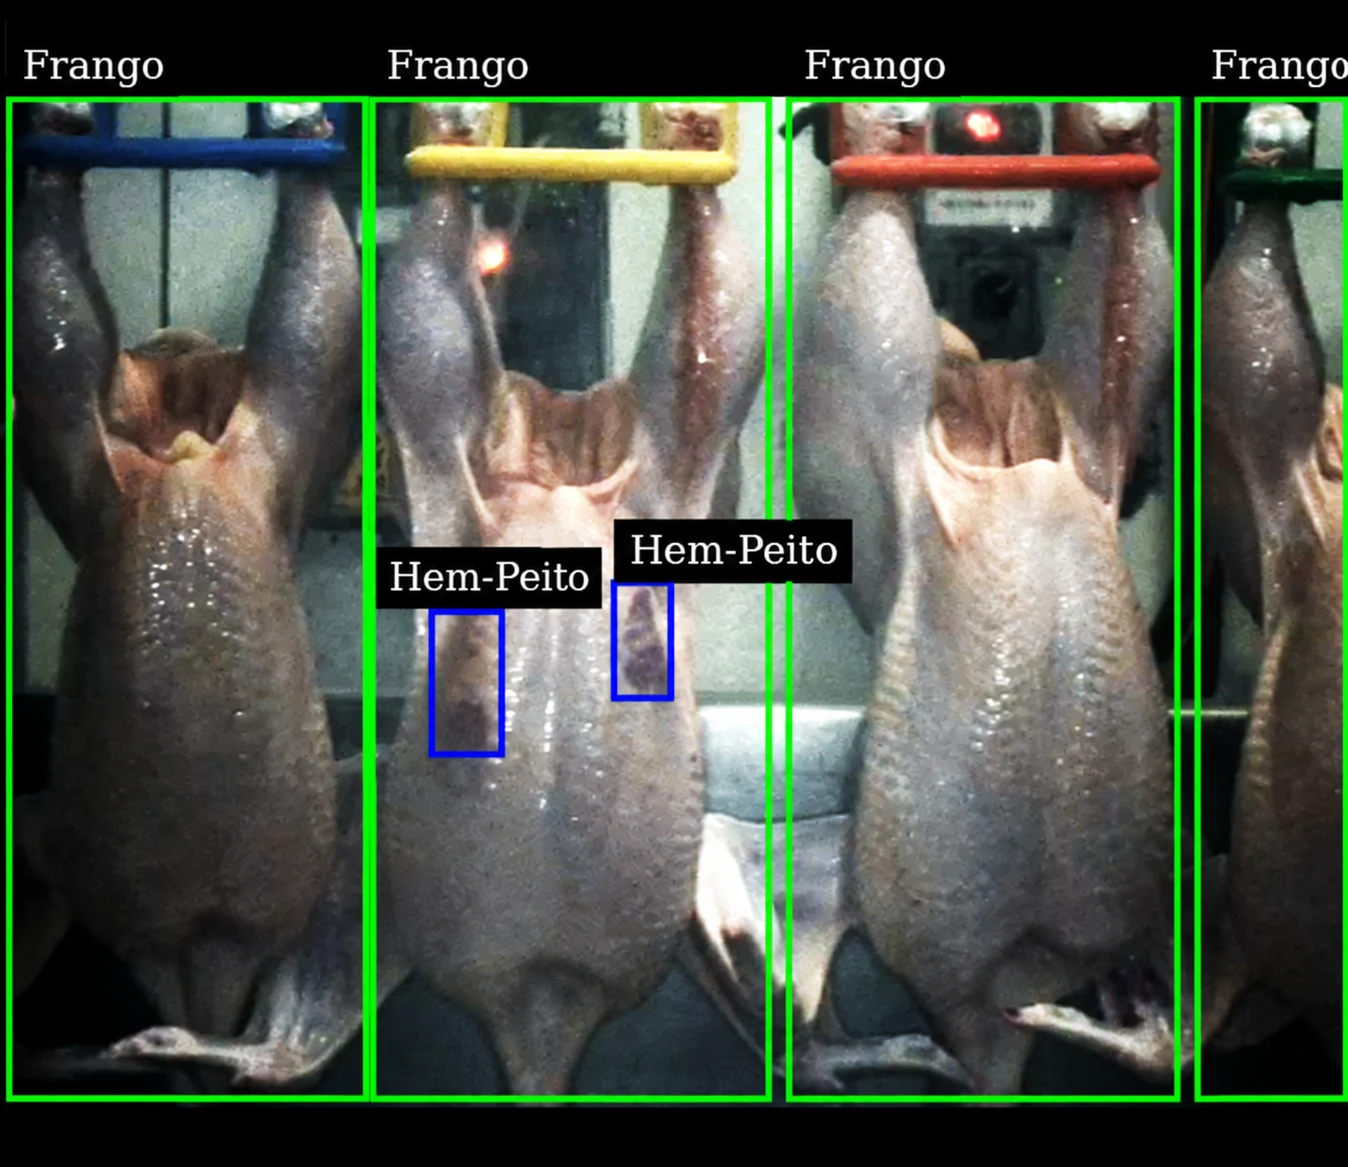
Inspection during evisceration to detect bruising on the breast, wings and thighs, as well as process defects.
C4 · Carcass back
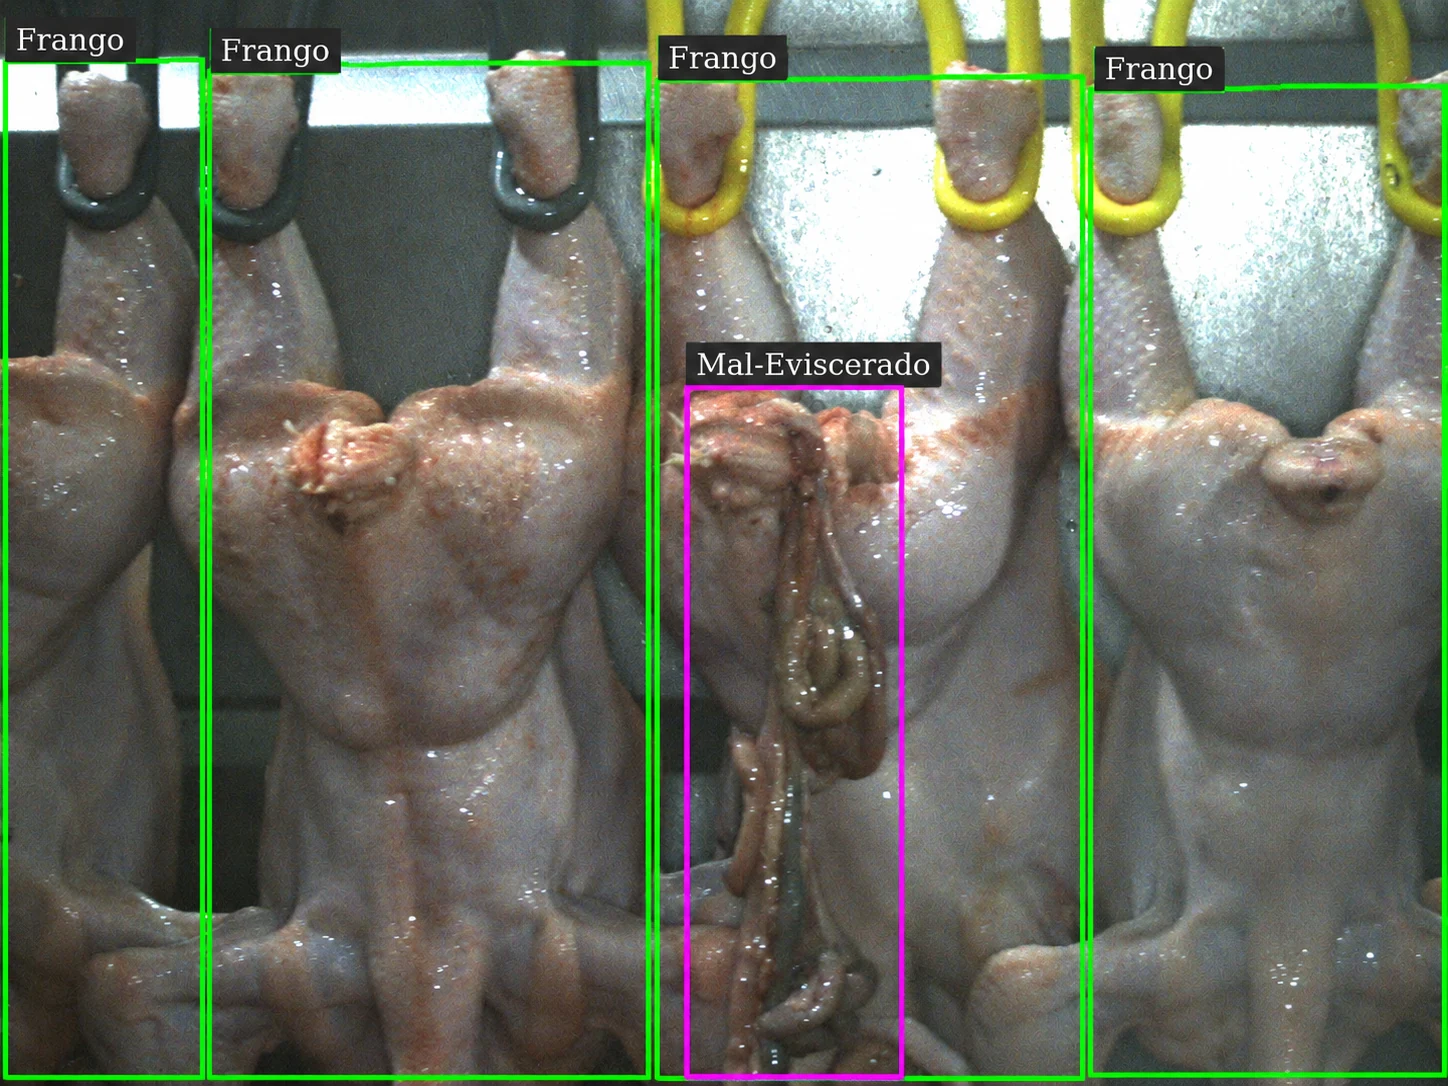
The rear view complements inspection and reveals other carcass conditions.
Technology in motion
From image to insight, directly on the processing line.
Connected to your operation
Processing schedules integrated via API or spreadsheet. Line events that give each load context.
Link volumes to the batch that passed through the line, rather than looking only at the shift total.
Compare quality across sources and identify where to focus investigations and improvements.
Compare counts for the same load throughout the process and identify differences in volume.
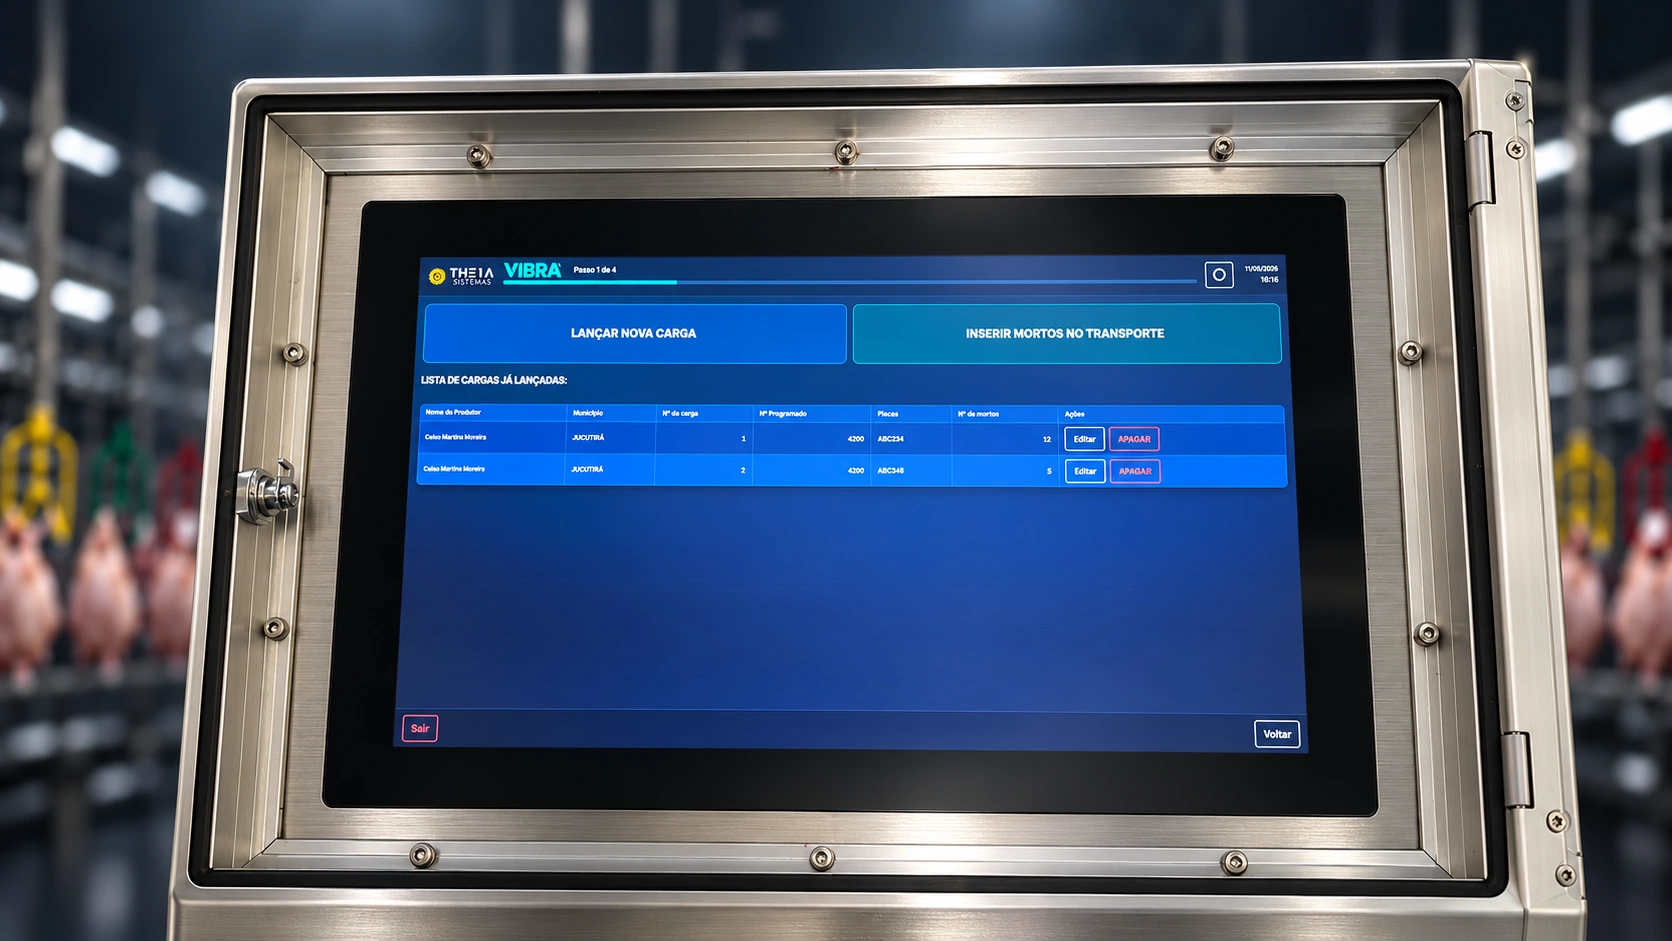
Control at the receiving platform
On the HMI, the supervisor sequences and manages loads directly at the receiving platform. Information follows the process from the start.
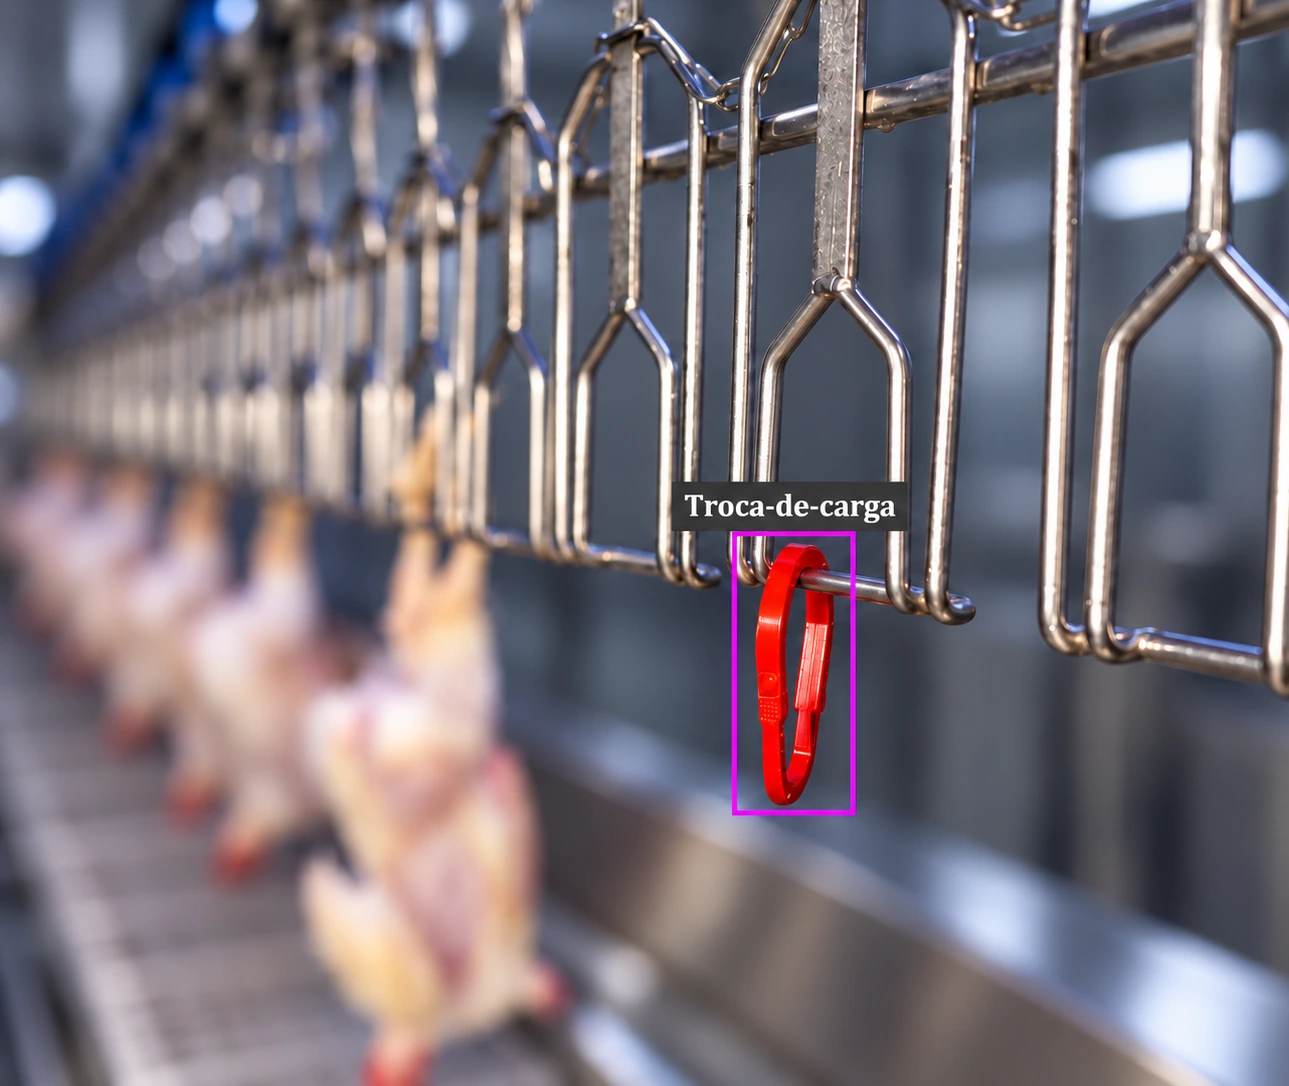
Identification on the line
A visual marker, such as a carabiner, indicates the end of each load. Computer vision recognizes this event and links the data to the batch.
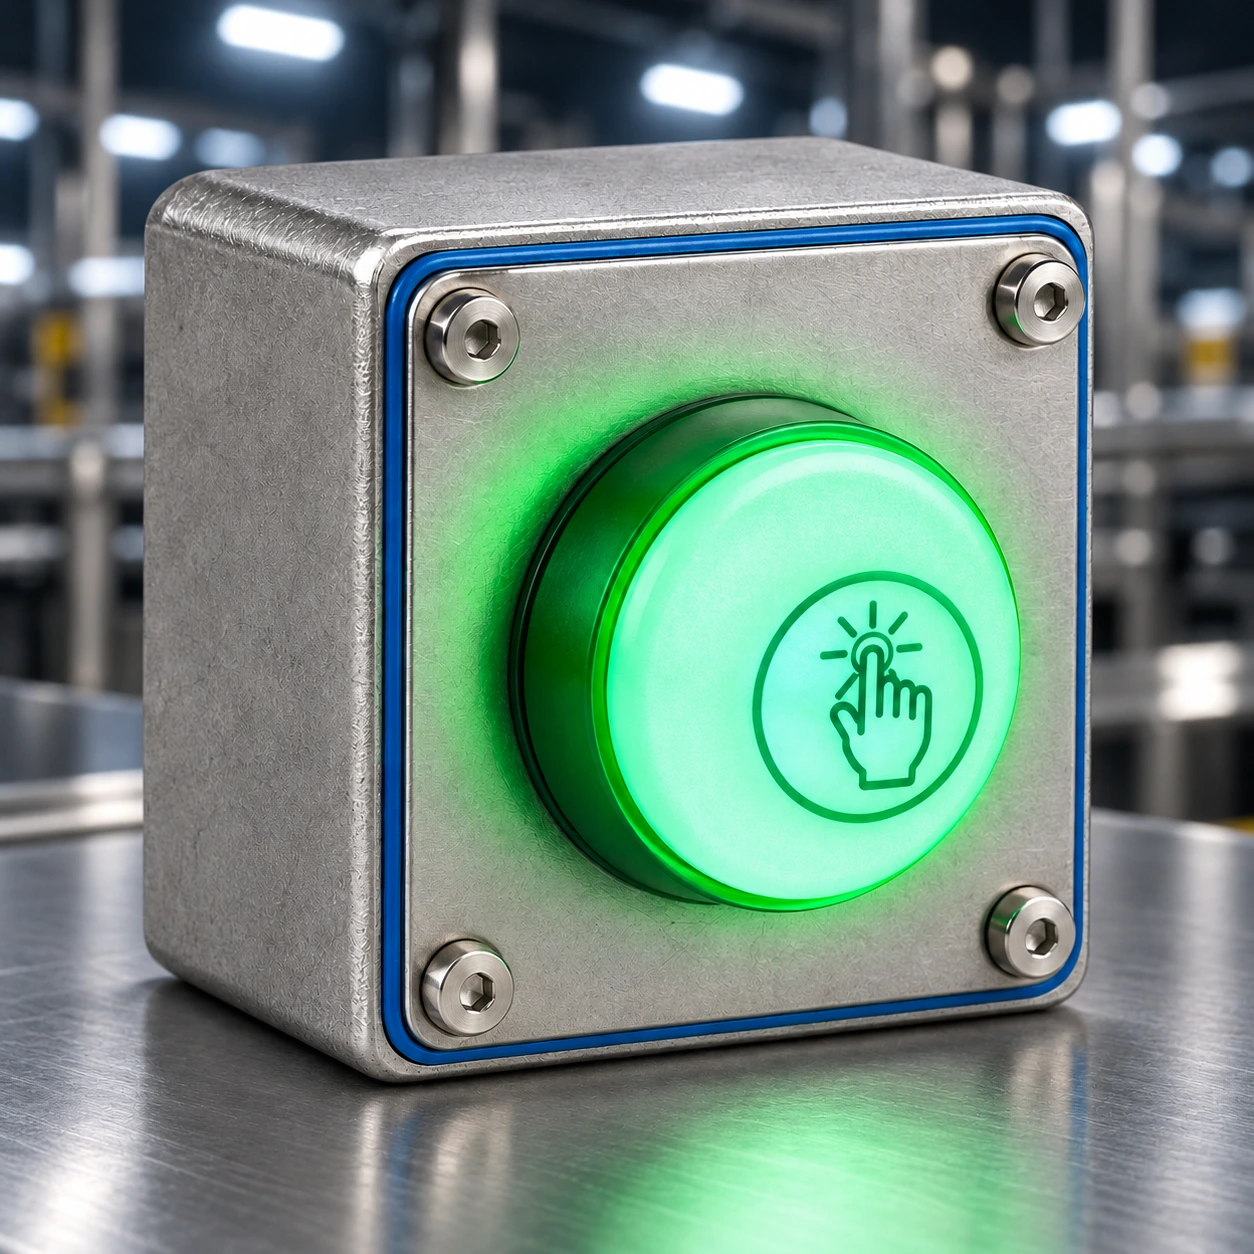
Signaling at shackling
As an alternative to the visual marker, the button signals the end of shackling for a load. A direct way to separate loads during operation.
Data intelligence
From the plant to the office, a connected view of production and quality.
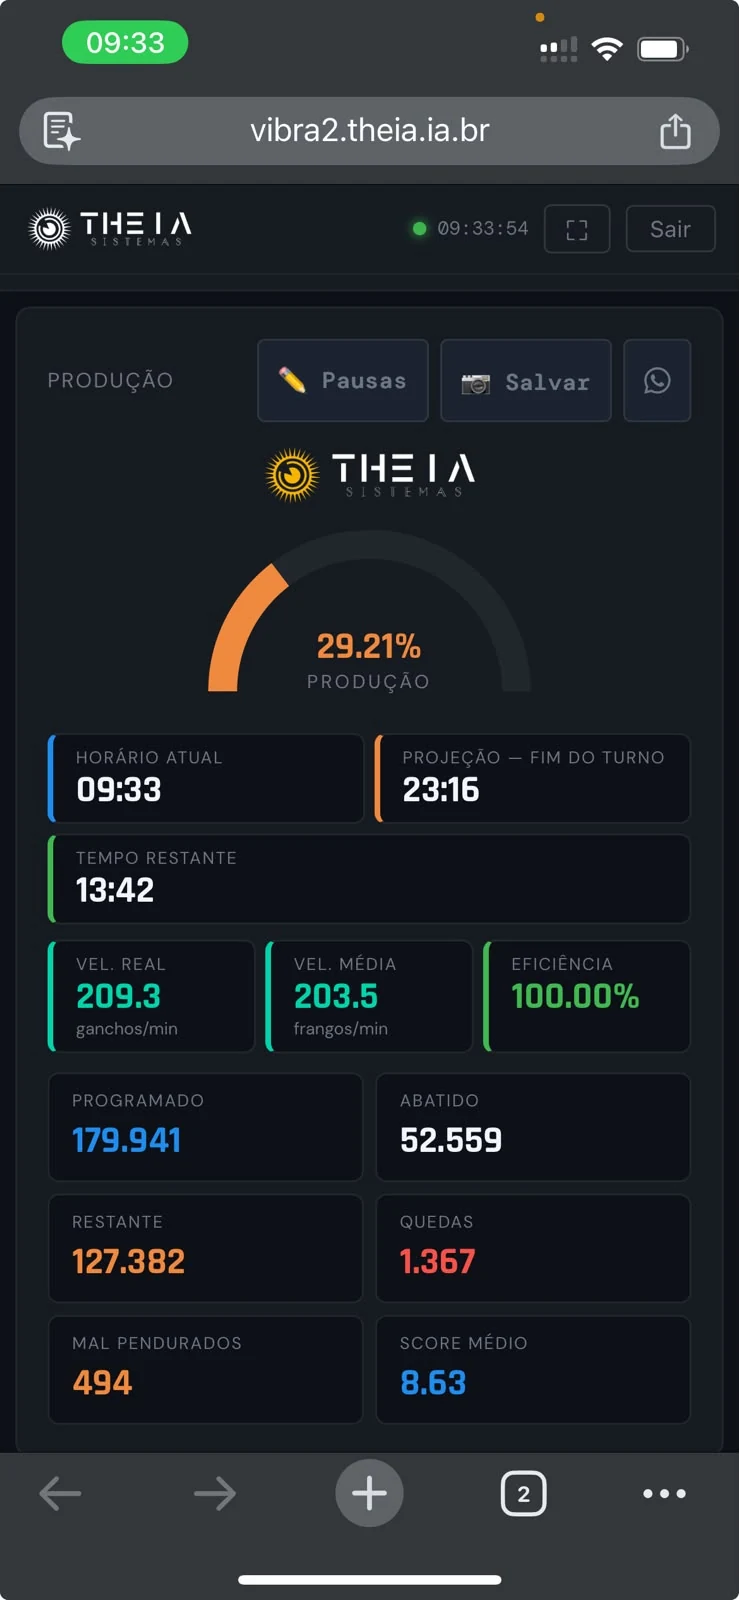
Monitor processing pace, line videos and estimated completion time. On your computer or phone.
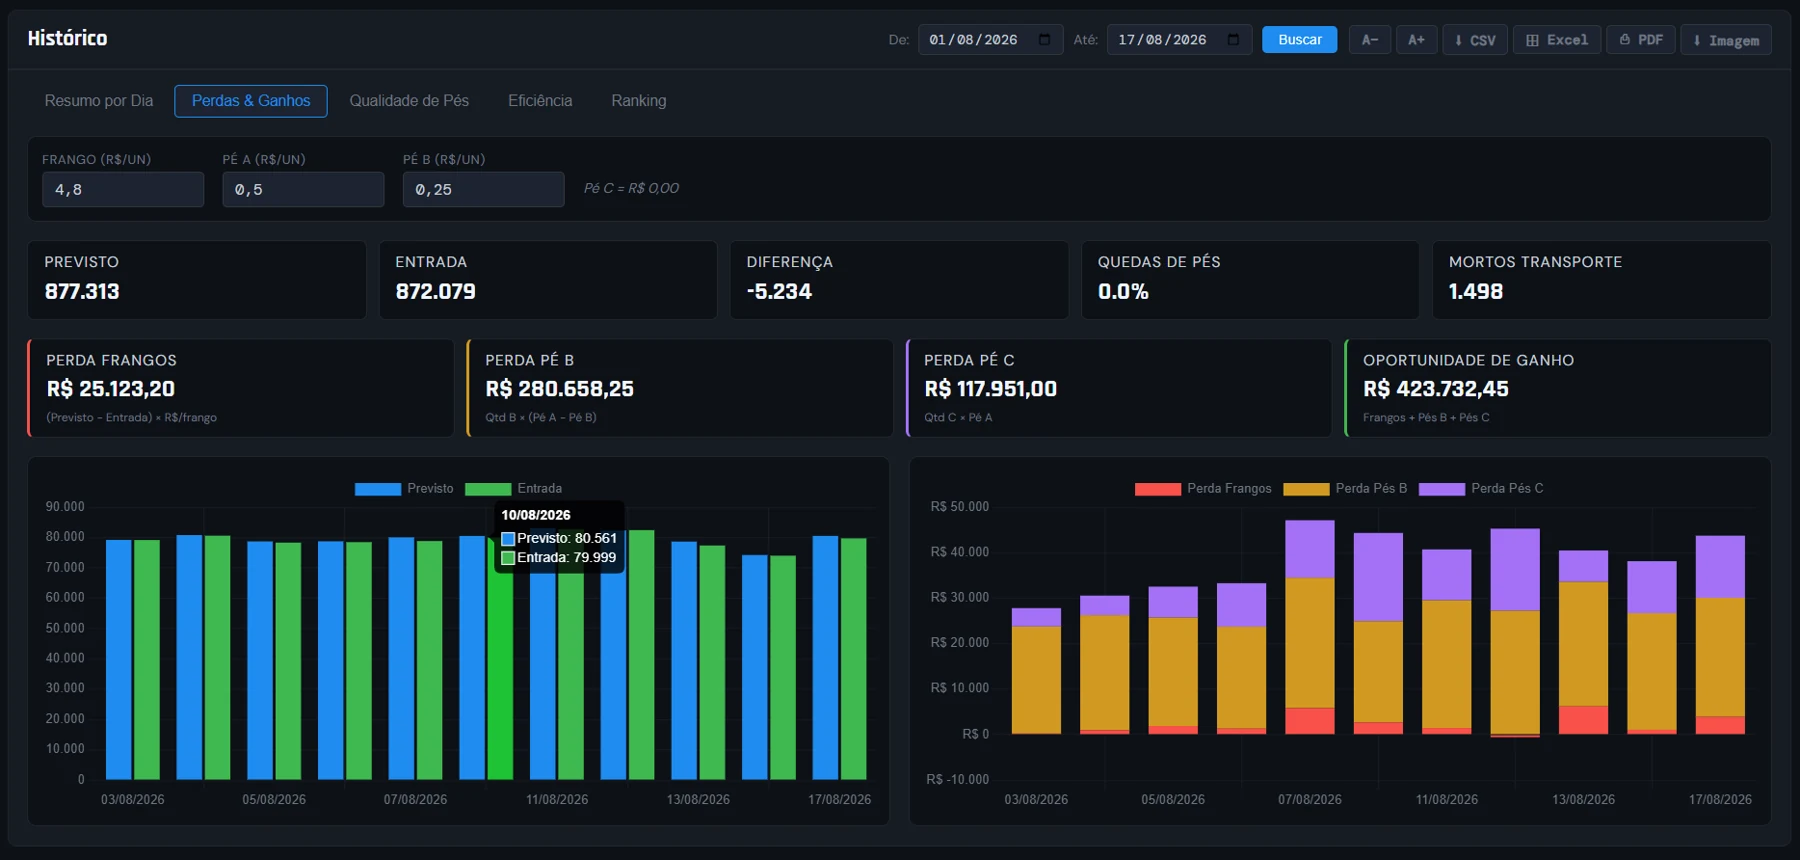
Compare periods, loads and contract growers. Understand losses and their financial impact, based on your operation's parameters.
Track trends in indicators and identify changes in production and quality.
Compare loads and contract growers to guide investigations into quality differences.
Assign financial values to losses and opportunities, based on your operation's parameters.
Built with your team
Analysis of the process and opportunities for improvement.
Development and adjustments to your plant's needs.
Installation and testing before going live.
Team training and support in using the solution.
About THEIA
Founded in 2024, THEIA combines meat processing industry knowledge with research in electronics and artificial intelligence.
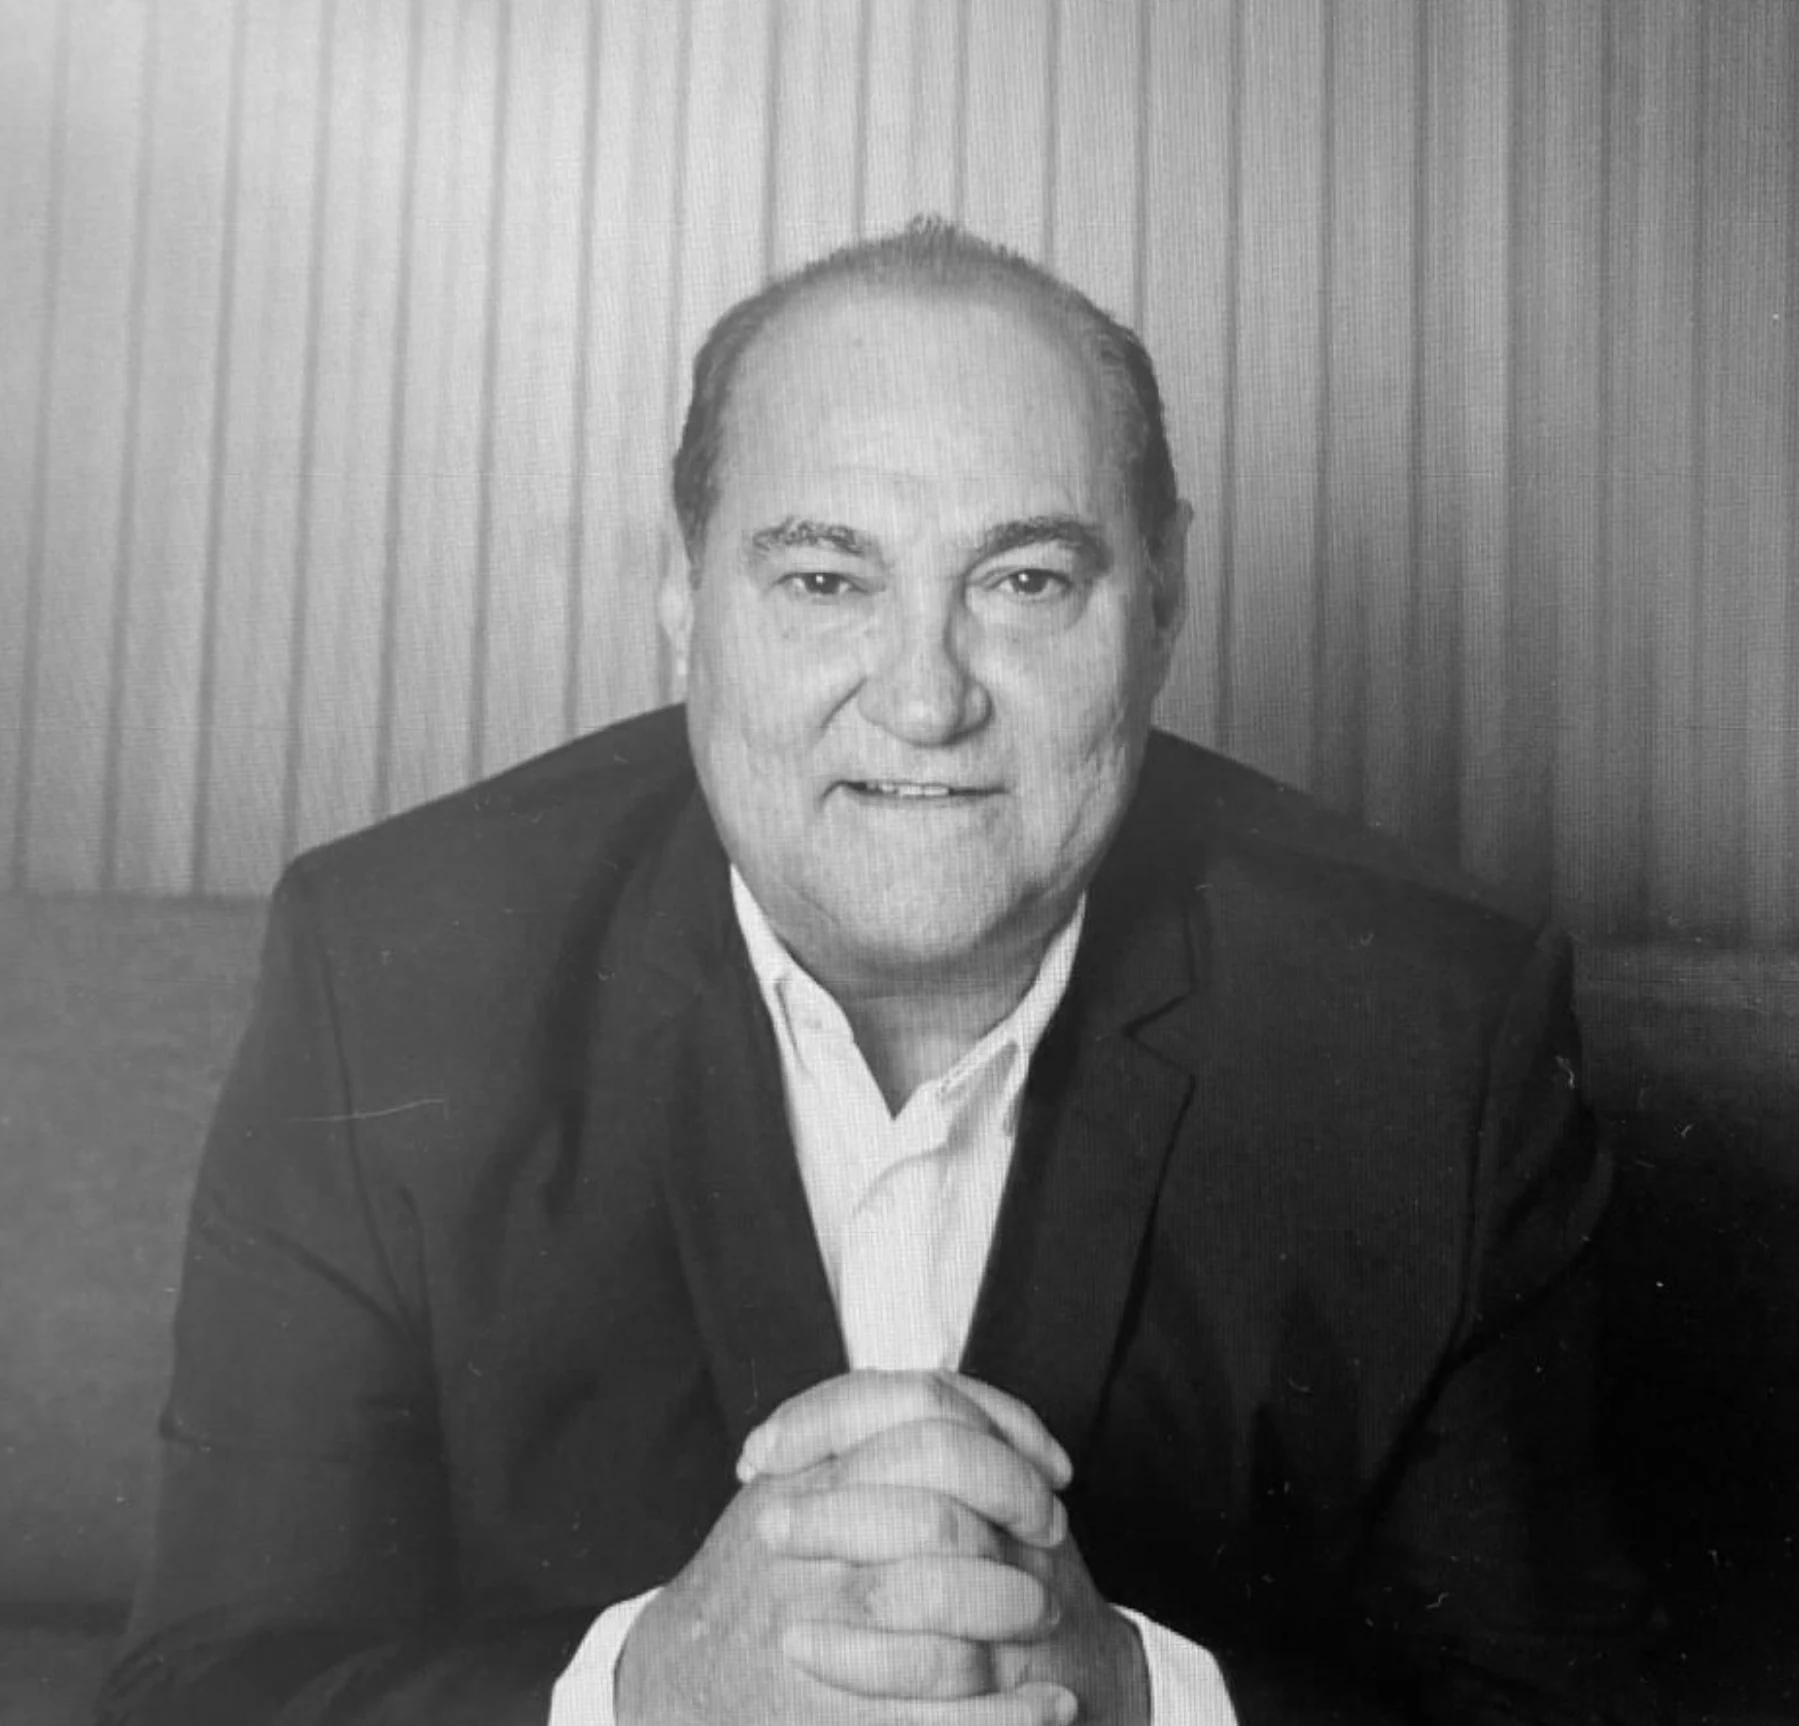
CEO
Over 40 years in the meat processing industry. Food Engineering and an MBA in Business Management.
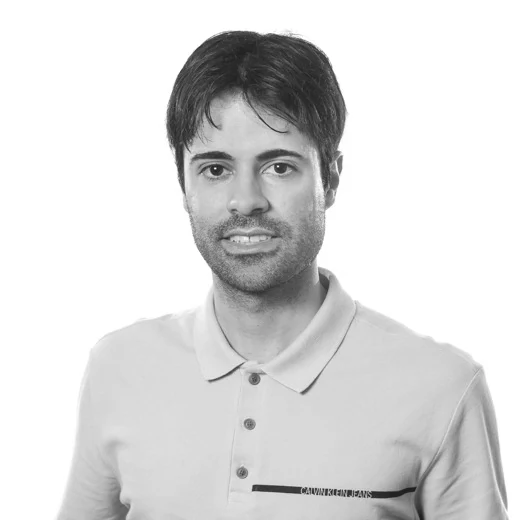
CTO
PhD from UFRGS, working in electronics and AI. Professor at the PUCRS Polytechnic School.

Academic consultant
PhD from the University of Newcastle, Australia. Professor at UFRGS and CNPq researcher.


São Sebastião do Caí, RS

Sete Lagoas plant, MG
Let's talk
Let's get to know your operation.
Schedule a THEIA demonstration.